Fourth Grade Math
Children who score proficiently on standardized math tests are more likely to do well in school overall. Nationally, significant disparities in math skills exist among 4th-graders by race/ethnicity, school type, and eligibility for the National School Lunch Program. [1].
The charts below present fourth grade math proficiency for students in Summit County Ohio belonging to different populations. The disparities seen in the charts highlight the need to reduce systemic inequality in educational opportunities.
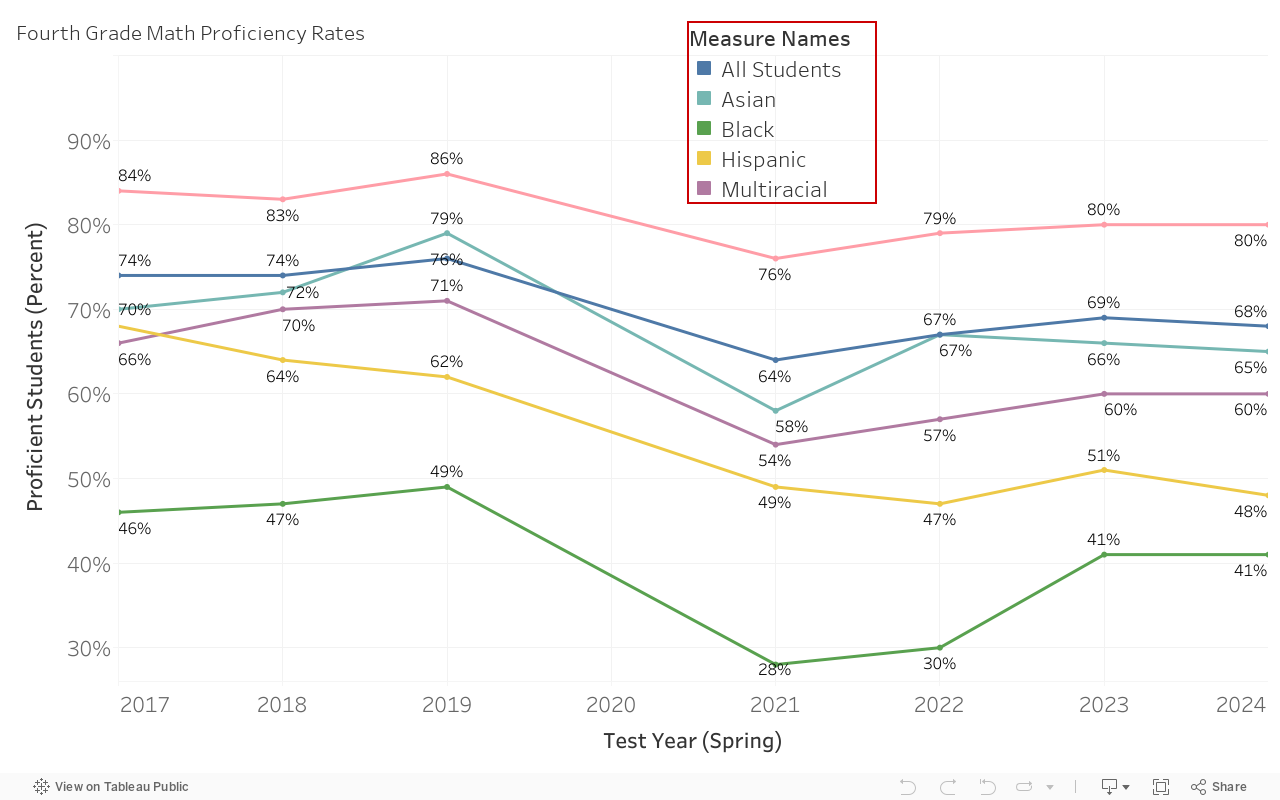
The chart below reports the percentage of students proficient on the fourth grade state math test by race/ethnicity since 2017. Here we see overall proficiency rate has declined since 2017, with disparities evident between racial/ethnic categories.
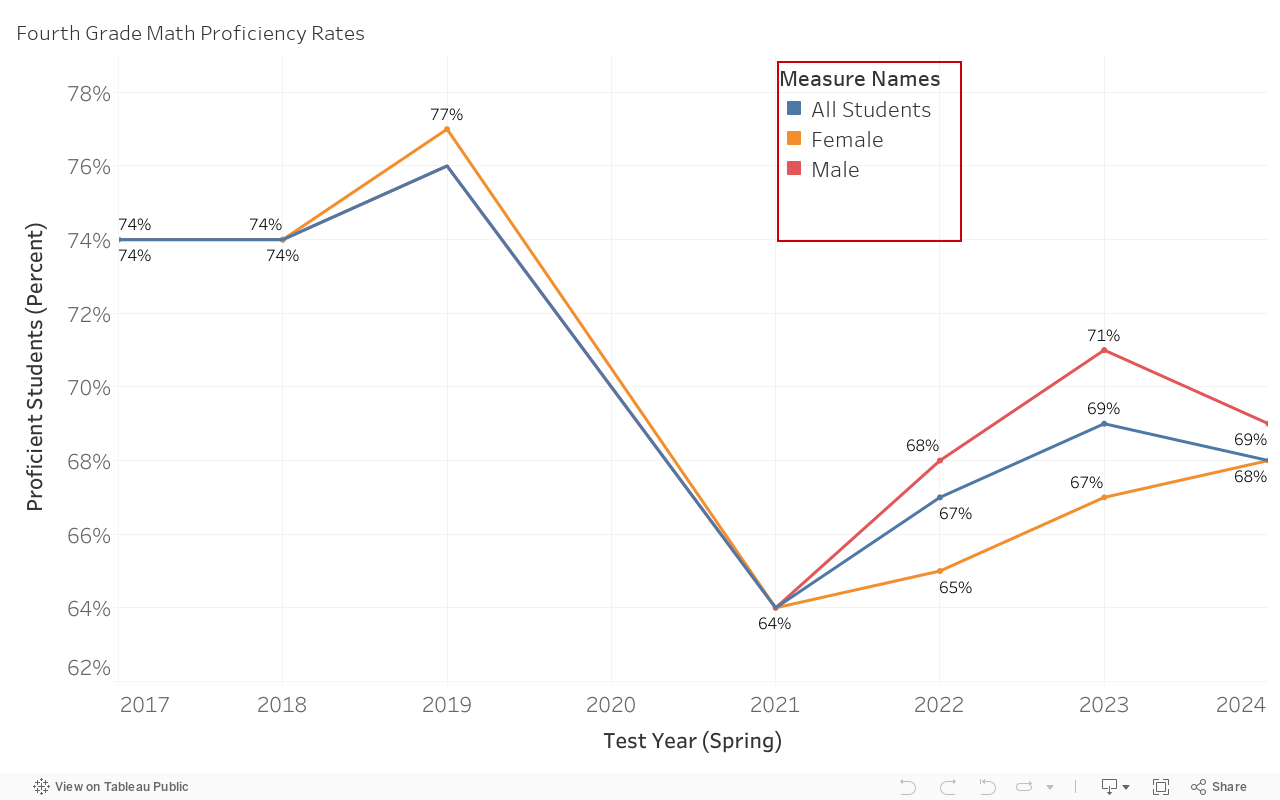
The chart below reports the percentage of students proficient on the fourth grade state math test by gender since 2017. We see that proficiency rates remain similar by gender, with Males showing a larger increase since a recent low in 2021.
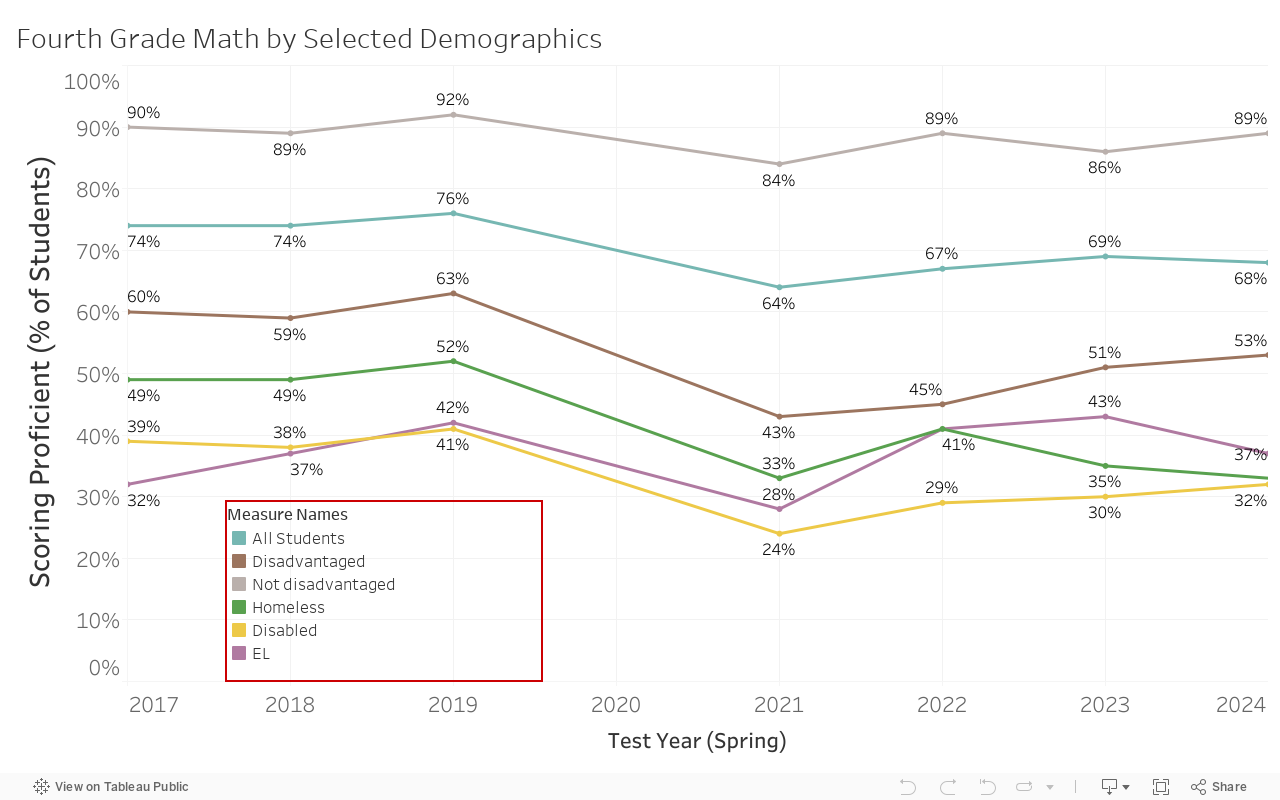
The chart below reports the percentage of students proficient on the fourth grade state math test by selected demographic characteristics since 2017. We see a particular disparity between students experiencing economic disadvantagement and those not experiencing economic disadvantagement. Currently, we consider qualifying for free or reduced priced lunch as the indicator for economic disadvantagement.
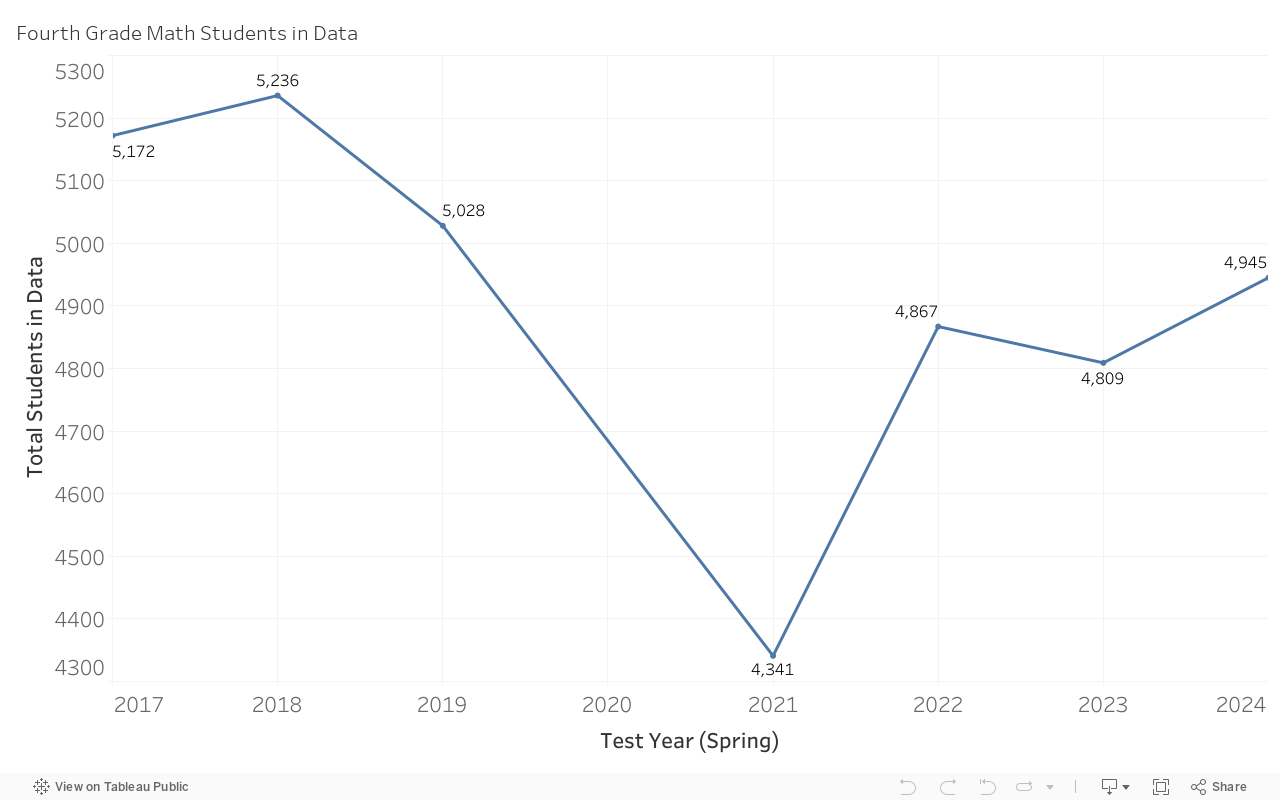
The chart below reports the n-size for All Students in the Fourth Grade Math data each year.
[1] “Increase the Proportion of 4th-Graders with Math Skills at or above the Proficient Level — AH‑06 – Healthy People 2030 | Health.gov.” Health.gov, health.gov/healthypeople/objectives-and-data/browse-objectives/schools/increase-proportion-4th-graders-math-skills-or-above-proficient-level-ah-06. Accessed 8 Jan. 2024.